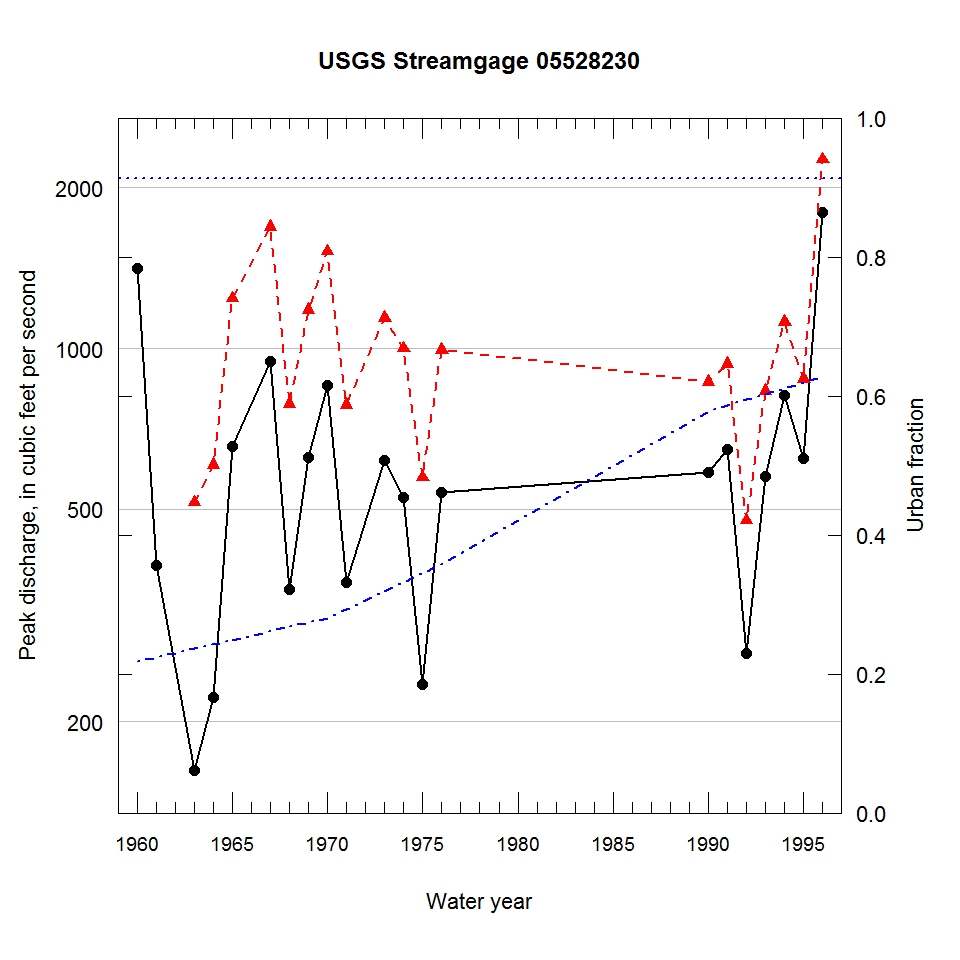
Observed and urbanization-adjusted annual maximum peak discharge and associated urban fraction and precipitation values at USGS streamgage:
05528230 INDIAN CREEK AT PRAIRIE VIEW, IL


| Water year | Segment | Discharge code | Cumulative reservoir storage (acre-feet) | Urban fraction | Precipitation (inches) | Observed peak discharge (ft3/s) | Adjusted peak discharge (ft3/s) | Exceedance probability |
| 1960 | 0 | -- | 2980 | 0.217 | 0.494 | 1410 | -- | -- |
| 1961 | 0 | -- | 2980 | 0.224 | 1.224 | 393 | -- | -- |
| 1963 | 1 | -- | 3474 | 0.236 | 1.251 | 162 | 515 | 0.935 |
| 1964 | 1 | -- | 3474 | 0.243 | 1.739 | 222 | 605 | 0.878 |
| 1965 | 1 | -- | 3474 | 0.249 | 0.561 | 656 | 1240 | 0.240 |
| 1967 | 1 | -- | 3474 | 0.262 | 0.924 | 945 | 1690 | 0.085 |
| 1968 | 1 | -- | 3474 | 0.268 | 1.232 | 354 | 786 | 0.696 |
| 1969 | 1 | -- | 3474 | 0.274 | 1.341 | 625 | 1180 | 0.288 |
| 1970 | 1 | -- | 3474 | 0.281 | 1.501 | 852 | 1520 | 0.129 |
| 1971 | 1 | 4B | 3474 | 0.293 | 0.249 | 364 | 784 | 0.699 |
| 1973 | 1 | -- | 3474 | 0.319 | 1.430 | 617 | 1140 | 0.330 |
| 1974 | 1 | -- | 3474 | 0.332 | 0.620 | 526 | 1000 | 0.463 |
| 1975 | 1 | -- | 3474 | 0.345 | 0.823 | 235 | 573 | 0.902 |
| 1976 | 1 | -- | 3474 | 0.358 | 1.241 | 537 | 994 | 0.469 |
| 1990 | 1 | -- | 3474 | 0.578 | 0.535 | 586 | 866 | 0.604 |
| 1991 | 1 | -- | 3474 | 0.586 | 0.861 | 646 | 935 | 0.529 |
| 1992 | 1 | E | 3474 | 0.595 | 0.599 | 268 | 476 | 0.952 |
| 1993 | 1 | -- | 3474 | 0.603 | 0.872 | 576 | 833 | 0.641 |
| 1994 | 1 | CE | 3580 | 0.611 | 0.624 | 815 | 1120 | 0.348 |
| 1995 | 1 | C | 3580 | 0.620 | 1.053 | 623 | 876 | 0.593 |
| 1996 | 1 | C | 3580 | 0.628 | 0.249 | 1800 | 2260 | 0.029 |

